How does the RBC Royal Bank Affordability Index work?
The RBC Royal Bank Affordability Index measures the percentage of median pre-tax income a household would need to allocate to purchase a property at market price (also known as the effort ratio). Financial expenses include mortgage payments (principal and interest), property taxes, and utilities. It assumes a 20% down payment and a 25-year amortized mortgage. Monthly payments are calculated using the representative five-year fixed mortgage rate offered by major Canadian banks during the period. The benchmark prices used come from RPS Real Property Solutions. The higher the affordability index, the more challenging it is to buy a property, and vice versa.
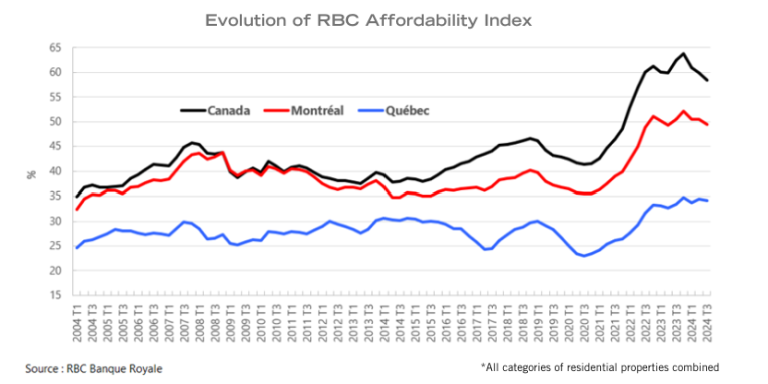
In Canada, the three main components of the index (see box) have contributed to improved property affordability: lower interest rates, rising income levels, and a decline in property prices, particularly in Ontario. The index dropped from a record high of 63.8% in Q4 2023 (indicating properties were at their least affordable) to 58.4% in Q3 2024.
More Modest Improvement in Quebec
The improvement has been more subdued in the two major Quebec markets tracked by RBC’s affordability index, primarily because property prices have not declined in the province. In the Montreal area, however, the index has steadily decreased over the past three quarters, dropping from 55.2% in Q4 2023 to 49.7% in Q3 2024.
In the Quebec City area, property prices have continued to rise steadily since the beginning of the year. It wasn’t until mortgage rates began to drop last summer that the index showed a slight decline, from 34.5% in Q2 2024 to 34.2% in Q3 2024.
Comparison Brings Comfort
Properties in Quebec remain significantly more affordable compared to the rest of Canada, especially in the Quebec City area (see chart below). For example, the effort ratio to buy a property in the Quebec City region (34.2%) was similar to Edmonton (33.6%) and Winnipeg (32.1%) but much lower than Calgary (42.2%), Halifax (44.8%), and Ottawa (47.3%).
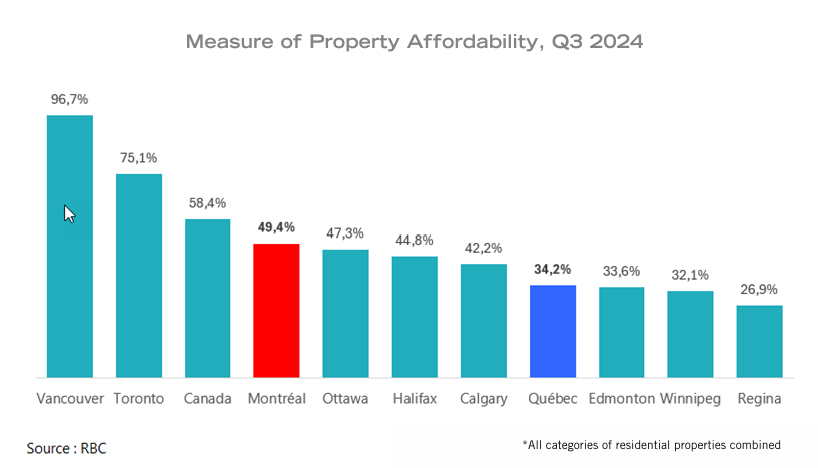
Regarding Quebec’s largest city, despite a relatively high index of 49.4%, Montreal’s situation is far from the sky-high levels of 75.1% in Toronto and 96.7% in Vancouver, respectively [1].